
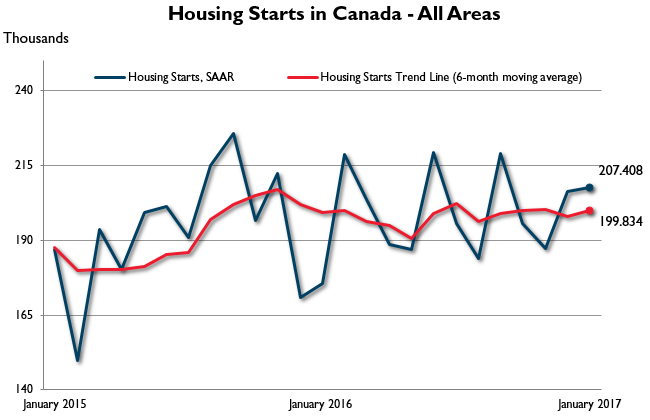
OTTAWA, February 8, 2017 — The trend measure of housing starts in Canada was 199,834 units in January compared to 197,881 in December, according to Canada Mortgage and Housing Corporation (CMHC). The trend is a six-month moving average of the monthly seasonally adjusted annual rates (SAAR) of housing starts.
“New home construction started off strong in 2017, both in terms of single-detached homes and multi-unit residential,” said Bob Dugan, CMHC Chief Economist. “While Ontario starts continue to drive the national trend upwards, construction has slowed in BC since last July when it reached a near record high. This slowdown can be partly attributed to builders focusing on projects still underway.”
CMHC uses the trend measure as a complement to the monthly SAAR of housing starts to account for considerable swings in monthly estimates and obtain a more complete picture of the state of Canada’s housing market. In some situations analyzing only SAAR data can be misleading, as they are largely driven by the multi-unit segment of the market which can vary significantly from one month to the next.
The standalone monthly SAAR for all areas in Canada was 207,408 units in January, up from 206,305 units in December. The SAAR of urban starts increased by 1.0 per cent in January to 189,688 units. Multiple urban starts increased by 4.2 per cent to 125,886 units in January and single-detached urban starts decreased by 4.6 per cent, to 63,802 units.
In January, the seasonally adjusted annual rate of urban starts increased in Ontario and Atlantic Canada, but decreased in British Columbia, the Prairies and Quebec.
Rural starts were estimated at a seasonally adjusted annual rate of 17,720 units.
Preliminary Housing Starts data is also available in English and French at the following link: Preliminary Housing Starts Tables
As Canada’s authority on housing, CMHC contributes to the stability of the housing market and financial system, provides support for Canadians in housing need, and offers objective housing research and information to Canadian governments, consumers and the housing industry.
For more information, follow us on Twitter, YouTube, LinkedIn and Facebook.
Original Source: <https://www.cmhc-schl.gc.ca/en/corp/nero/nere/2017/2017-02-08-0816.cfm
Information on This Release:
Karine LeBlanc
CMHC Media Relations
613-740-5413
kjleblan@cmhc-schl.gc.ca
Additional data is available upon request.
| December 2016 | January 2017 | |
|---|---|---|
| Trend1, all areas | 197,881 | 199,834 |
| SAAR, all areas | 206,305 | 207,408 |
| SAAR, rural areas2 | 18,553 | 17,720 |
| SAAR, urban centres3 | ||
| Single-detached | 66,895 | 63,802 |
| Multiples | 120,857 | 125,886 |
| Total | 187,752 | 189,688 |
| Atlantic, urban centres3 | 5,208 | 5,941 |
| Quebec, urban centres3 | 33,444 | 31,475 |
| Ontario, urban centres3 | 77,474 | 96,883 |
| Prairies, urban centres3 | 32,615 | 29,081 |
| British Columbia, urban centres3 | 39,011 | 26,308 |
| Canada | January 2016 | January 2017 |
| Actual, all areas | 10,217 | 12,964 |
| Actual, rural areas2 | 508 | 638 |
| Actual, urban centres3 | ||
| January — Single-detached | 3,191 | 3,318 |
| January — Multiples | 6,518 | 9,008 |
| January — Total | 9,709 | 12,326 |
| January to January — Single-detached | 3,191 | 3,318 |
| January to January — Multiples | 6,518 | 9,008 |
| January to January — Total | 9,709 | 12,326 |
Source: CMHC
1 The trend is a six-month moving average of the monthly seasonally adjusted annual rates (SAAR). By removing seasonal ups and downs, seasonal adjustment allows for comparison of adjacent months and quarters. The monthly and quarterly SAAR and trend figures indicate the annual level of starts that would be obtained if the same pace of monthly or quarterly construction activity was maintained for 12 months. This facilitates comparison of the current pace of activity to annual forecasts as well as to historical annual levels.
2 CMHC estimates the level of starts in centres with a population of less than 10,000 for each of the three months of the quarter, at the beginning of each quarter. During the last month of the quarter, CMHC conducts the survey in these centres and revises the estimate.
3 Urban centres with a population of 10,000 and over.
Detailed data available upon request